
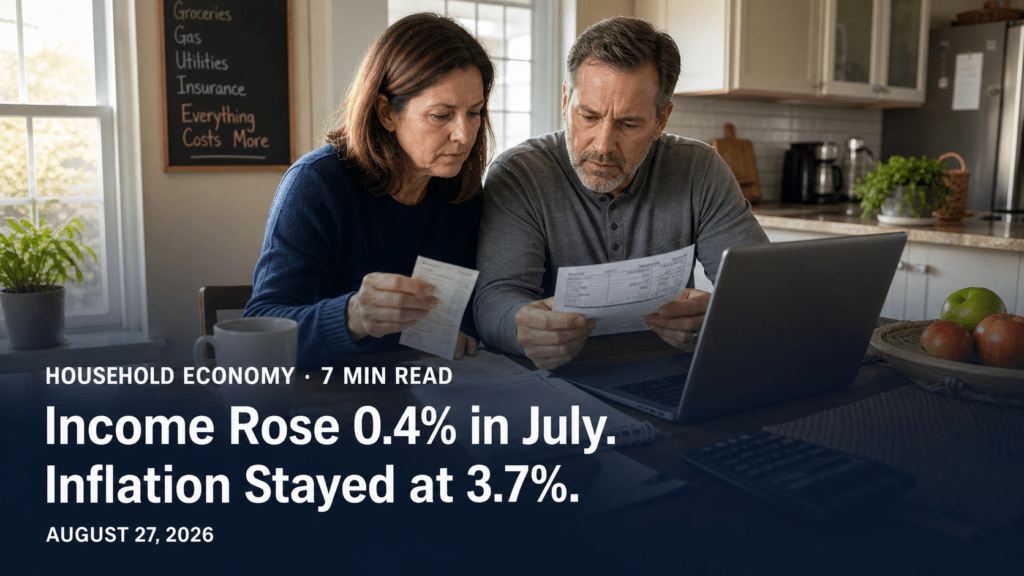
Americans’ after-tax income grew faster than their spending in July, allowing the saving rate to improve. But inflation remained well above the Federal Reserve’s 2% goal, and inflation-adjusted consumer spending was essentially flat.
The Bottom Line
The Bureau of Economic Analysis reported that personal income rose 0.4% in July, disposable income increased 0.5%, and consumer spending advanced 0.2%. The saving rate improved to 3.0% from 2.7% in June. That is a better monthly balance for household finances. Yet the PCE price index was 3.7% higher than a year earlier, and real consumer spending increased by less than 0.1%. Households gained some breathing room, but the purchasing-power squeeze did not disappear.
What changed in July
Personal income increased by $115.1 billion at a monthly rate, according to BEA’s August 26 release. The agency said the gain primarily reflected higher compensation, government social benefits and income from assets. Private wages and salaries led the compensation increase, while Medicaid and Medicare were the main contributors to the rise in government benefits.
Disposable personal income—income left after personal current taxes—rose by $125.9 billion, or 0.5%. Consumer spending increased by $36.3 billion, or 0.2%. Because after-tax income rose faster than outlays, personal saving climbed to $712.0 billion and the saving rate increased to 3.0%.
The spending details were mixed. Current-dollar spending on services rose by $86.2 billion, while spending on goods fell by $49.9 billion. After adjusting for prices, total consumer spending increased by only $1.3 billion, which BEA describes as less than 0.1% at a monthly rate. In plain language, Americans spent more dollars, but those dollars bought almost no additional volume of goods and services.
| July household measure | Monthly change / level | What it suggests |
|---|---|---|
| Personal income | +0.4% | Income growth strengthened |
| Disposable income | +0.5% | After-tax income outpaced spending |
| Consumer spending | +0.2% | Nominal demand cooled |
| Real consumer spending | Less than +0.1% | Purchasing volume was nearly flat |
| Saving rate | 3.0% | Up from 2.7% in June |
Income growth offered a modest cushion
July’s most constructive household signal is the gap between disposable income growth and spending growth. When after-tax income rises 0.5% while outlays rise 0.2%, households as a group can save a larger share of their income. That is exactly what happened: the saving rate rose three-tenths of a percentage point.
This improvement should not be overstated. A 3.0% saving rate remains a thin national cushion, and the aggregate figure does not show how the gains are distributed. A household receiving higher wages or interest income may be able to rebuild savings, while a household facing high rent, insurance or medical costs may still have no monthly surplus. National averages describe the total economy, not every family’s experience.
The release also shows why a single income number can mislead. Personal income includes wages, benefits, interest, dividends and other sources. July’s increase was not solely a paycheck story. For a household budget, the relevant comparison is recurring take-home income against recurring expenses—not the national headline by itself.
Inflation still absorbed purchasing power
The PCE price index increased 0.2% from June and 3.7% from July 2025. Excluding food and energy, the index also rose 0.2% for the month and 3.3% over the year. The Federal Reserve watches PCE inflation closely because the measure covers a broad range of household spending and adjusts as consumers change what they buy.
A 3.7% annual rate does not mean every price increased by exactly 3.7%, and it does not mean prices fell when inflation slows. It means the overall price level measured by PCE was 3.7% higher than a year earlier. Households can therefore experience continued pressure even when the monthly number looks moderate.
Real disposable income increased 0.4% in July, which means after-tax income still rose after accounting for the month’s price change. That is favorable. At the same time, real spending was nearly unchanged, suggesting consumers did not translate the income gain into much more consumption. This could reflect caution, debt repayment, rebuilding cash reserves or simply the timing of purchases. The BEA report establishes the totals, but it does not prove which motive dominated.
A practical household reset
Use the income-spending gap as a model for your own monthly review. Compare the last three months of take-home pay with essential bills, minimum debt payments and discretionary spending. If income has improved, assign the gain before it disappears into routine purchases.
A simple order of operations is: first protect the next month’s essential bills, then reduce high-cost revolving debt, then rebuild emergency savings, and only then increase optional spending. This is a planning framework, not individualized financial advice.
Three checks for your own budget
- Separate price increases from usage increases. If a utility, grocery or insurance bill rose, identify whether the unit price changed, consumption changed or both. The remedy depends on the cause.
- Calculate your personal saving rate. Divide the amount left after spending by after-tax income. Compare it with your own prior months rather than treating the 3.0% national rate as a target.
- Review automatic spending. Subscriptions, renewals and minimum-payment habits can expand quietly. Cancel low-value charges and redirect the cash to a named priority.
What to Watch
- September 30: BEA is scheduled to release August personal income, spending and PCE inflation.
- Saving-rate durability: One monthly increase is encouraging, but several months are needed to establish a stronger household trend.
- Services spending: Services drove July’s dollar increase while goods spending declined.
- Revisions: BEA will incorporate its annual update on September 30, and historical estimates may change.
Sources and Methodology
This analysis uses the Bureau of Economic Analysis Personal Income and Outlays, July 2026 release, published August 26, 2026, including its technical notes and related-data guidance. Monthly percentage changes are reported at monthly rates; year-over-year inflation compares July 2026 with July 2025. Aggregate national estimates do not describe the finances of every household.
Read Also
Browse the latest practical reports from American Media Press
Financial Information Notice: This article provides general educational information and is not individualized financial, tax or investment advice.